

How to Read Forex Charts for Beginners
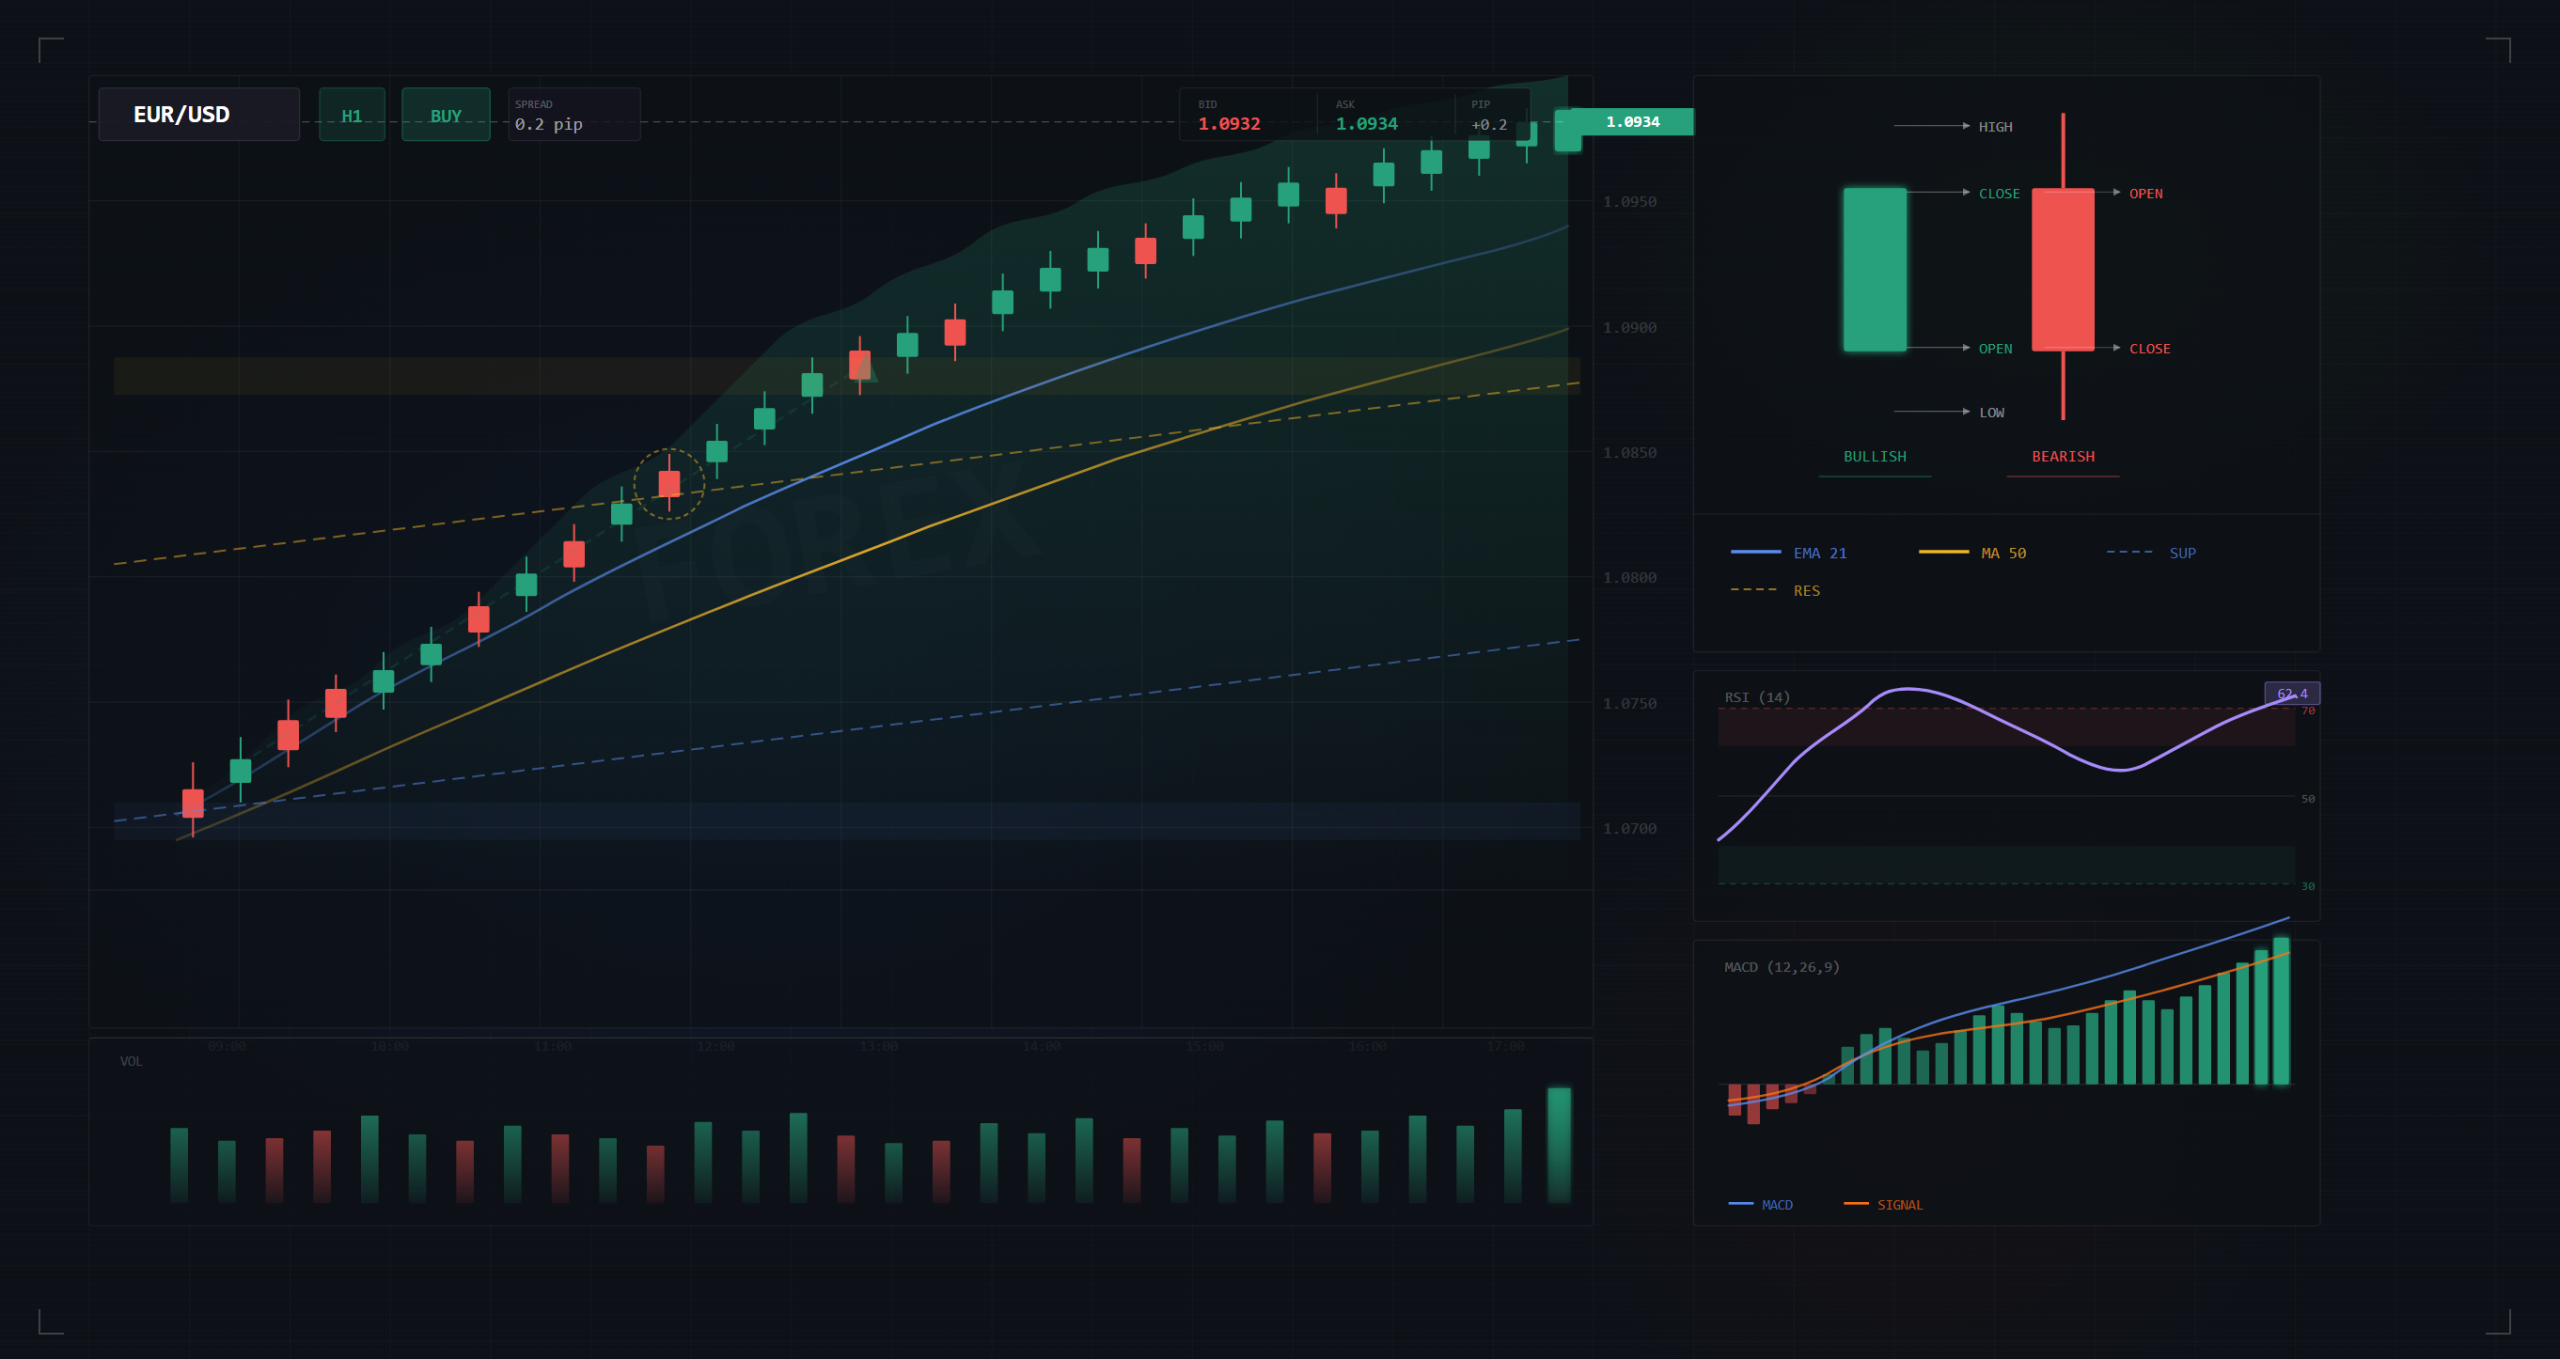
At ICunity, learning how to read Forex charts is one of the first and most important steps in becoming a confident trader. Charts are the foundation of market analysis—they show you how prices move, where opportunities may exist, and when to enter or exit trades.
Are you ready to transform your financial future?
Sign Up TodayNo credit card required • Free demo account • Instant activation
For beginners, charts may look confusing at first, but once you understand the basics, they become a powerful tool.
What Is a Forex Chart?
A Forex chart is a visual representation of how a currency pair’s price changes over time. It shows:
- Price movements
- Market trends
- Patterns and behavior
For example, a chart for EUR/USD shows how the euro is performing against the US dollar.
Types of Forex Charts
There are three main types of charts beginners should know:
1. Line Chart
- Simple and clean
- Connects closing prices over time
- Good for spotting overall trends
2. Bar Chart
- Shows open, high, low, and close prices
- More detailed than a line chart
3. Candlestick Chart (Most Popular)
- Visually clear and easy to read
- Shows market sentiment
- Widely used by traders
Most beginners start with candlestick charts because they provide the most useful information.
Understanding Candlesticks
Each candlestick represents price movement during a specific time period.
A candlestick shows:
- Open price
- Close price
- High price
- Low price
There are two main types:
- Bullish candle (usually green): Price closed higher than it opened
- Bearish candle (usually red): Price closed lower than it opened
Candles help traders understand who is in control—buyers or sellers.
Timeframes Explained
Charts can be viewed in different timeframes depending on your trading style:
- 1-minute (M1) – very fast movements
- 15-minute (M15) – short-term trades
- 1-hour (H1) – intraday analysis
- Daily (D1) – long-term trends
Day traders prefer shorter timeframes, while swing traders often use higher ones.
Identifying Trends
One of the first things to look for on a chart is the trend.
- Uptrend: Higher highs and higher lows
- Downtrend: Lower highs and lower lows
- Sideways (range): Price moves within a range
Trading with the trend increases your chances of success.
Support and Resistance
These are key levels on a chart:
- Support: A price level where the market tends to stop falling
- Resistance: A level where price struggles to move higher
These levels help traders decide where to enter or exit trades.
Basic Chart Patterns
Charts often form patterns that repeat over time.
Some common beginner patterns:
- Double Top/Bottom – potential reversal
- Breakouts – price moves beyond support or resistance
- Consolidation – market pauses before a move
Recognizing these patterns helps traders anticipate price movements.
The Role of News and Events
Charts don’t move on their own—real-world events drive them.
For example, decisions from the Federal Reserve can cause strong movements in USD pairs.
Understanding both charts and news gives you a complete picture of the market.
Tips for Beginners
- Start with candlestick charts
- Focus on one timeframe at first
- Learn support and resistance
- Avoid using too many indicators
- Practice on a demo account
Most importantly, take your time—chart reading improves with experience.
Final Thoughts
At ICunity, we believe that learning to read Forex charts is like learning a new language. At first, it may seem complex, but with practice, patterns become clear and decision-making becomes easier.
Charts don’t predict the future perfectly—but they help you understand market behavior and make informed trading decisions.
Mastering chart reading is one of the strongest foundations you can build in your trading journey.