

Multi-Timeframe Analysis Explained Step by Step
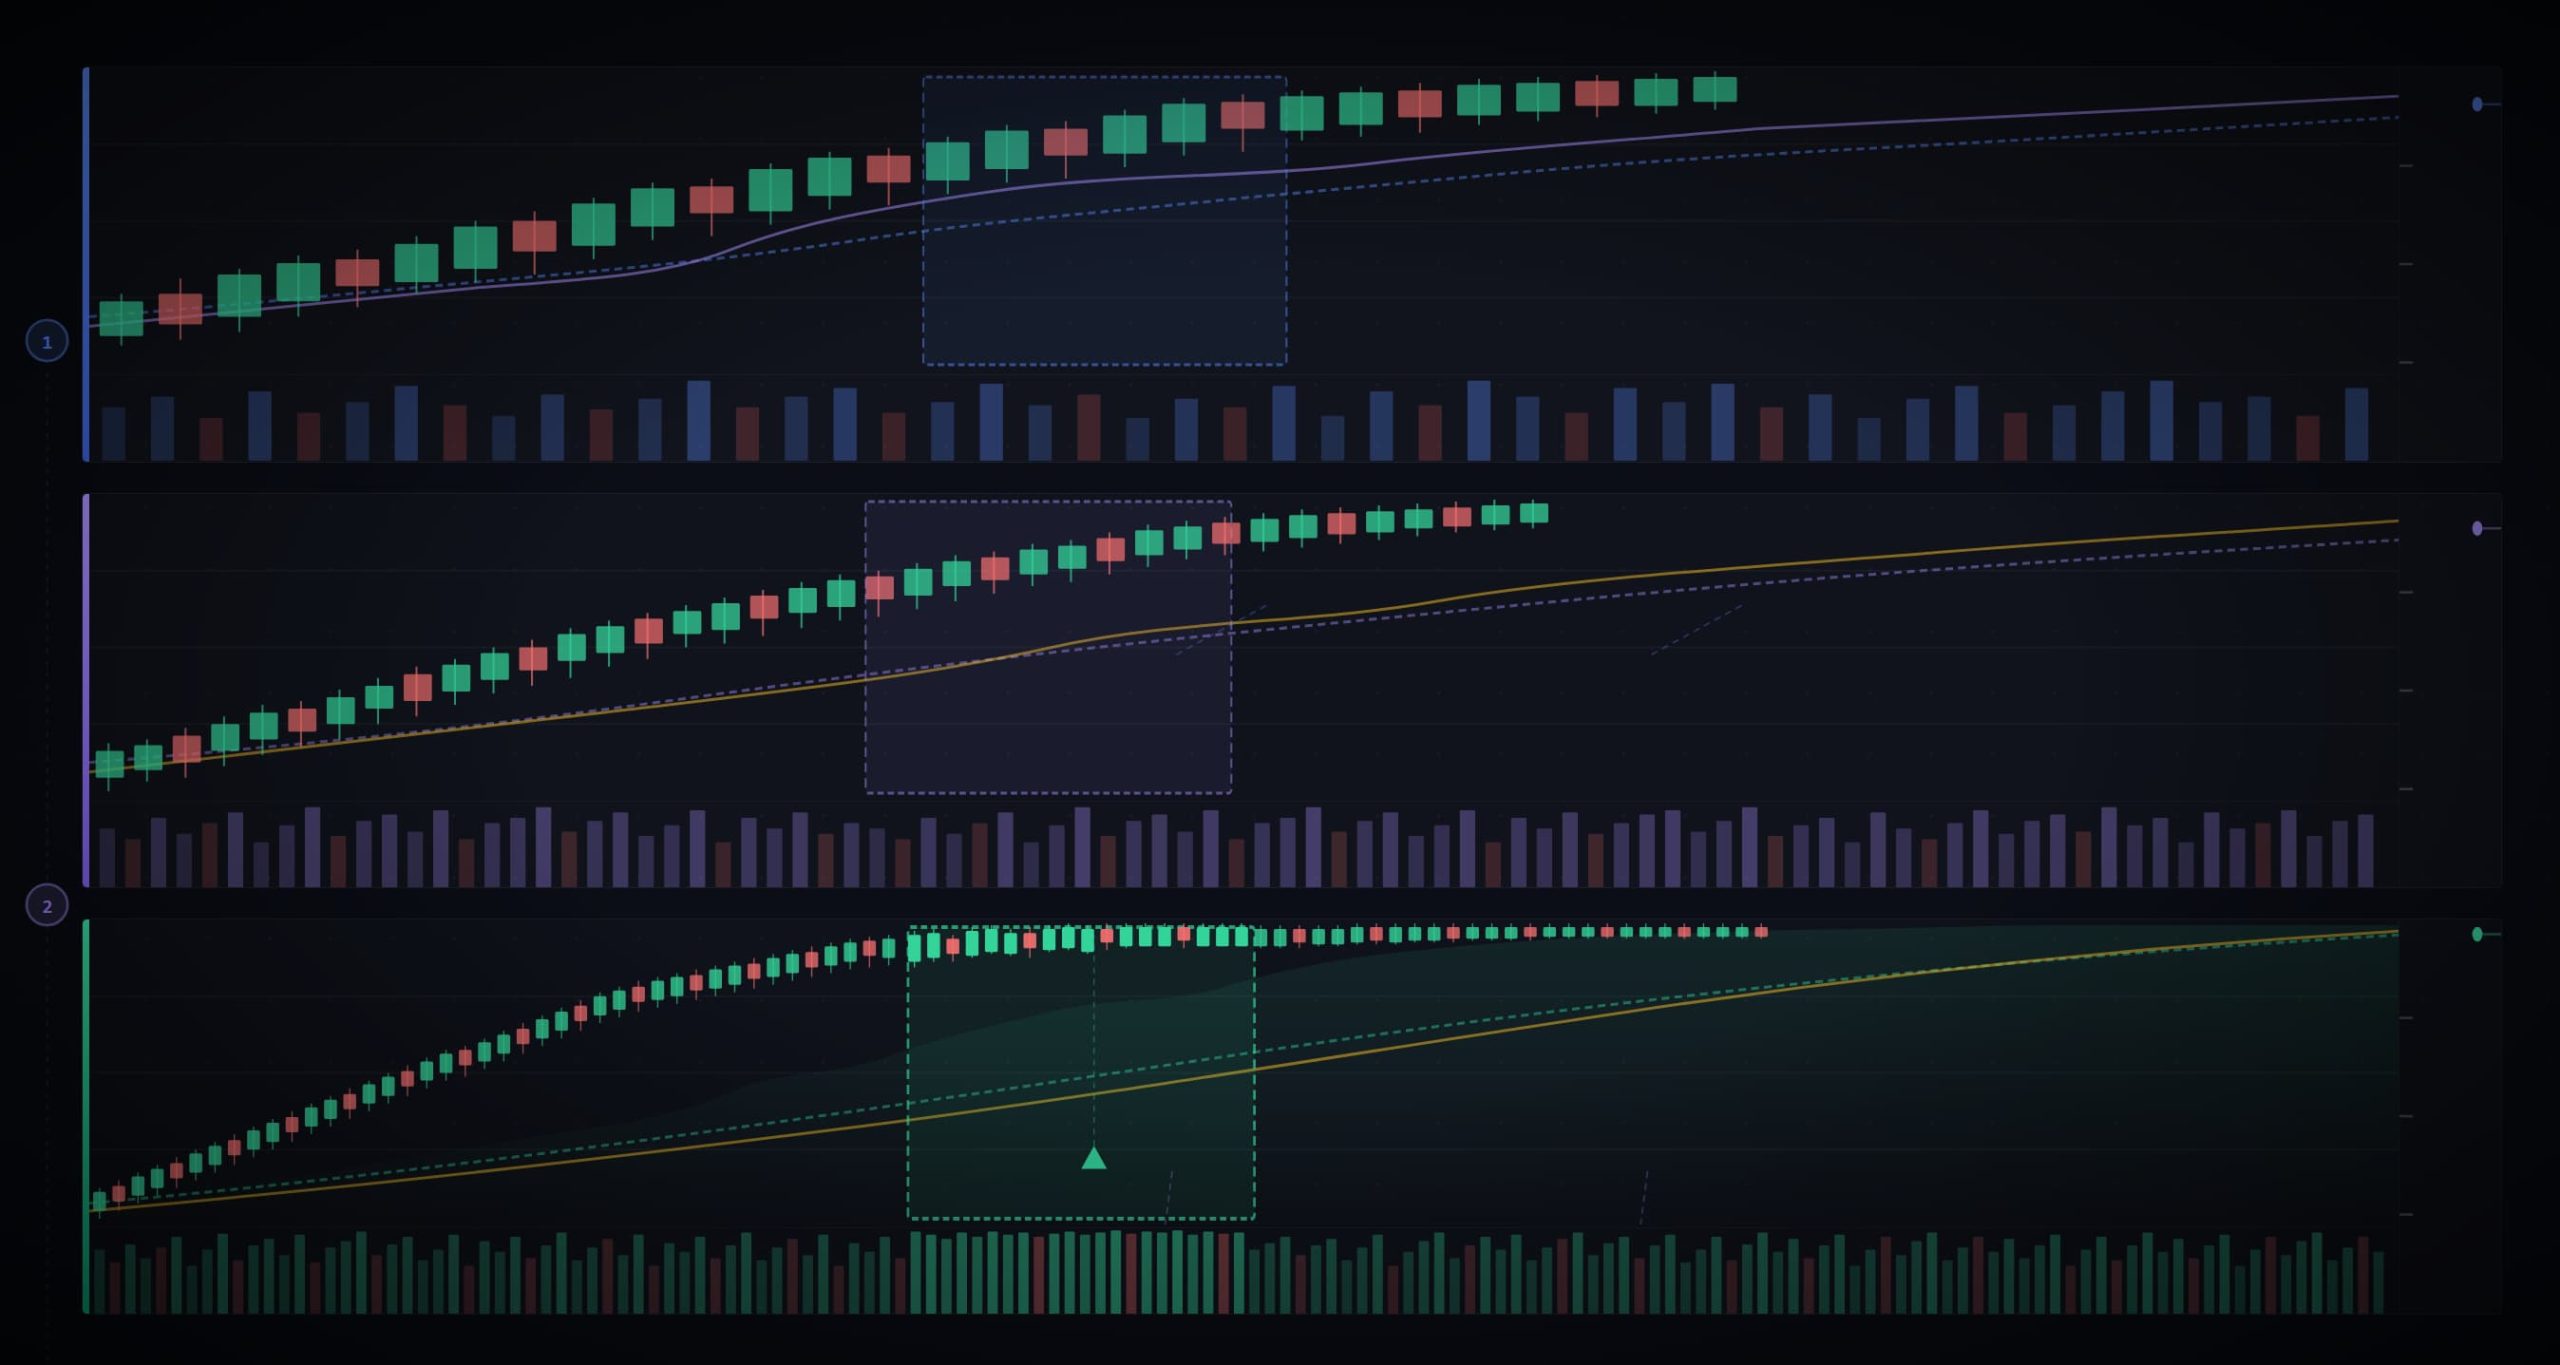
At ICunity, one of the most effective ways traders improve decision-making is through multi-timeframe analysis. Instead of looking at only one chart, traders analyze multiple timeframes together to better understand market direction, momentum, and entry opportunities.
Are you ready to transform your financial future?
Sign Up TodayNo credit card required • Free demo account • Instant activation
This approach helps traders avoid confusion and trade with more confidence and structure.
What Is Multi-Timeframe Analysis?
Multi-timeframe analysis means analyzing the same market on different chart timeframes.
For example:
- Daily chart → overall trend
- 4-hour chart → setup confirmation
- 1-hour chart → trade entry
The goal is to align trades with the bigger market picture.
Why Multi-Timeframe Analysis Matters
Many beginners make the mistake of:
- Trading only one timeframe
- Ignoring the larger trend
- Entering trades against momentum
Multi-timeframe analysis helps traders:
- Improve trade accuracy
- Reduce false signals
- Understand market context
- Find better entry points
Step-by-Step Guide to Multi-Timeframe Analysis
Step 1: Start with the Higher Timeframe
The higher timeframe shows the overall market direction.
Common Higher Timeframes:
- Daily (D1)
- 4-Hour (H4)
What to Look For:
- Trend direction
- Major support and resistance
- Market structure
Ask yourself:
- Is the market trending up?
- Trending down?
- Moving sideways?
The higher timeframe acts like your market roadmap.
Example
Imagine EUR/USD on the Daily chart:
- Higher highs
- Higher lows
- Strong bullish momentum
This suggests the overall trend is upward.
Step 2: Move to the Medium Timeframe
The medium timeframe helps refine your analysis.
Common Medium Timeframes:
- 1-Hour (H1)
- 4-Hour (H4)
What to Analyze:
- Pullbacks
- Trend continuation patterns
- Support and resistance zones
At this stage, traders look for setups that align with the higher timeframe trend.
Example
If the Daily chart is bullish:
- Wait for pullbacks on the H1 or H4 chart
- Look for buying opportunities instead of selling
This keeps trades aligned with momentum.
Step 3: Use the Lower Timeframe for Entry
The lower timeframe helps pinpoint precise entries.
Common Lower Timeframes:
- 15-Minute (M15)
- 5-Minute (M5)
Look For:
- Entry confirmation
- Candlestick patterns
- Breakouts or reversals
This timeframe helps improve risk-to-reward ratios and stop-loss placement.
Example Entry
Higher timeframe → bullish
Medium timeframe → pullback completed
Lower timeframe → bullish engulfing candle appears
This could signal a potential buy setup.
The Three-Timeframe Rule
A common structure many traders use:
Purpose Timeframe Trend Direction Daily Setup Analysis 4-Hour Entry Timing 1-Hour or 15-Minute
This creates a structured and organized approach.
Benefits of Multi-Timeframe Analysis
1. Better Trend Awareness
You avoid trading against major market direction.
2. Higher Quality Setups
Trades become more selective and strategic.
3. Improved Risk Management
More precise entries can reduce stop-loss size.
4. Reduced Emotional Trading
Clear structure helps traders stay disciplined.
Common Beginner Mistakes
1. Using Too Many Timeframes
Analyzing too many charts creates confusion.
Stick to 2–3 timeframes maximum.
2. Ignoring Higher Timeframes
Lower timeframe signals are weaker if they go against the larger trend.
3. Forcing Trades
Not every timeframe will align perfectly.
Patience is important.
Best Tools for Multi-Timeframe Analysis
Platforms like:
- TradingView
- MetaTrader 5
allow traders to switch between timeframes quickly and efficiently.
The Role of News and Market Events
Major economic events can affect all timeframes simultaneously.
For example, announcements from the Federal Reserve may suddenly shift market direction across short-term and long-term charts.
This is why traders should always stay aware of important economic news.
Is Multi-Timeframe Analysis Good for Beginners?
Yes. In fact, it can help beginners:
- Understand market structure better
- Avoid random entries
- Improve overall trade quality
However, simplicity is important. Beginners should avoid overcomplicating the process.
Final Thoughts
At ICunity, multi-timeframe analysis is viewed as a powerful way to understand the market more clearly and improve trading consistency. By combining higher timeframe trends with lower timeframe entries, traders can make more informed decisions instead of reacting emotionally to every market move.
The key is simple:
- Start with the bigger picture
- Refine the setup
- Execute with discipline
When used properly, multi-timeframe analysis can transform trading from guesswork into a more structured and strategic process.