

RSI Trading Strategy Explained Simply
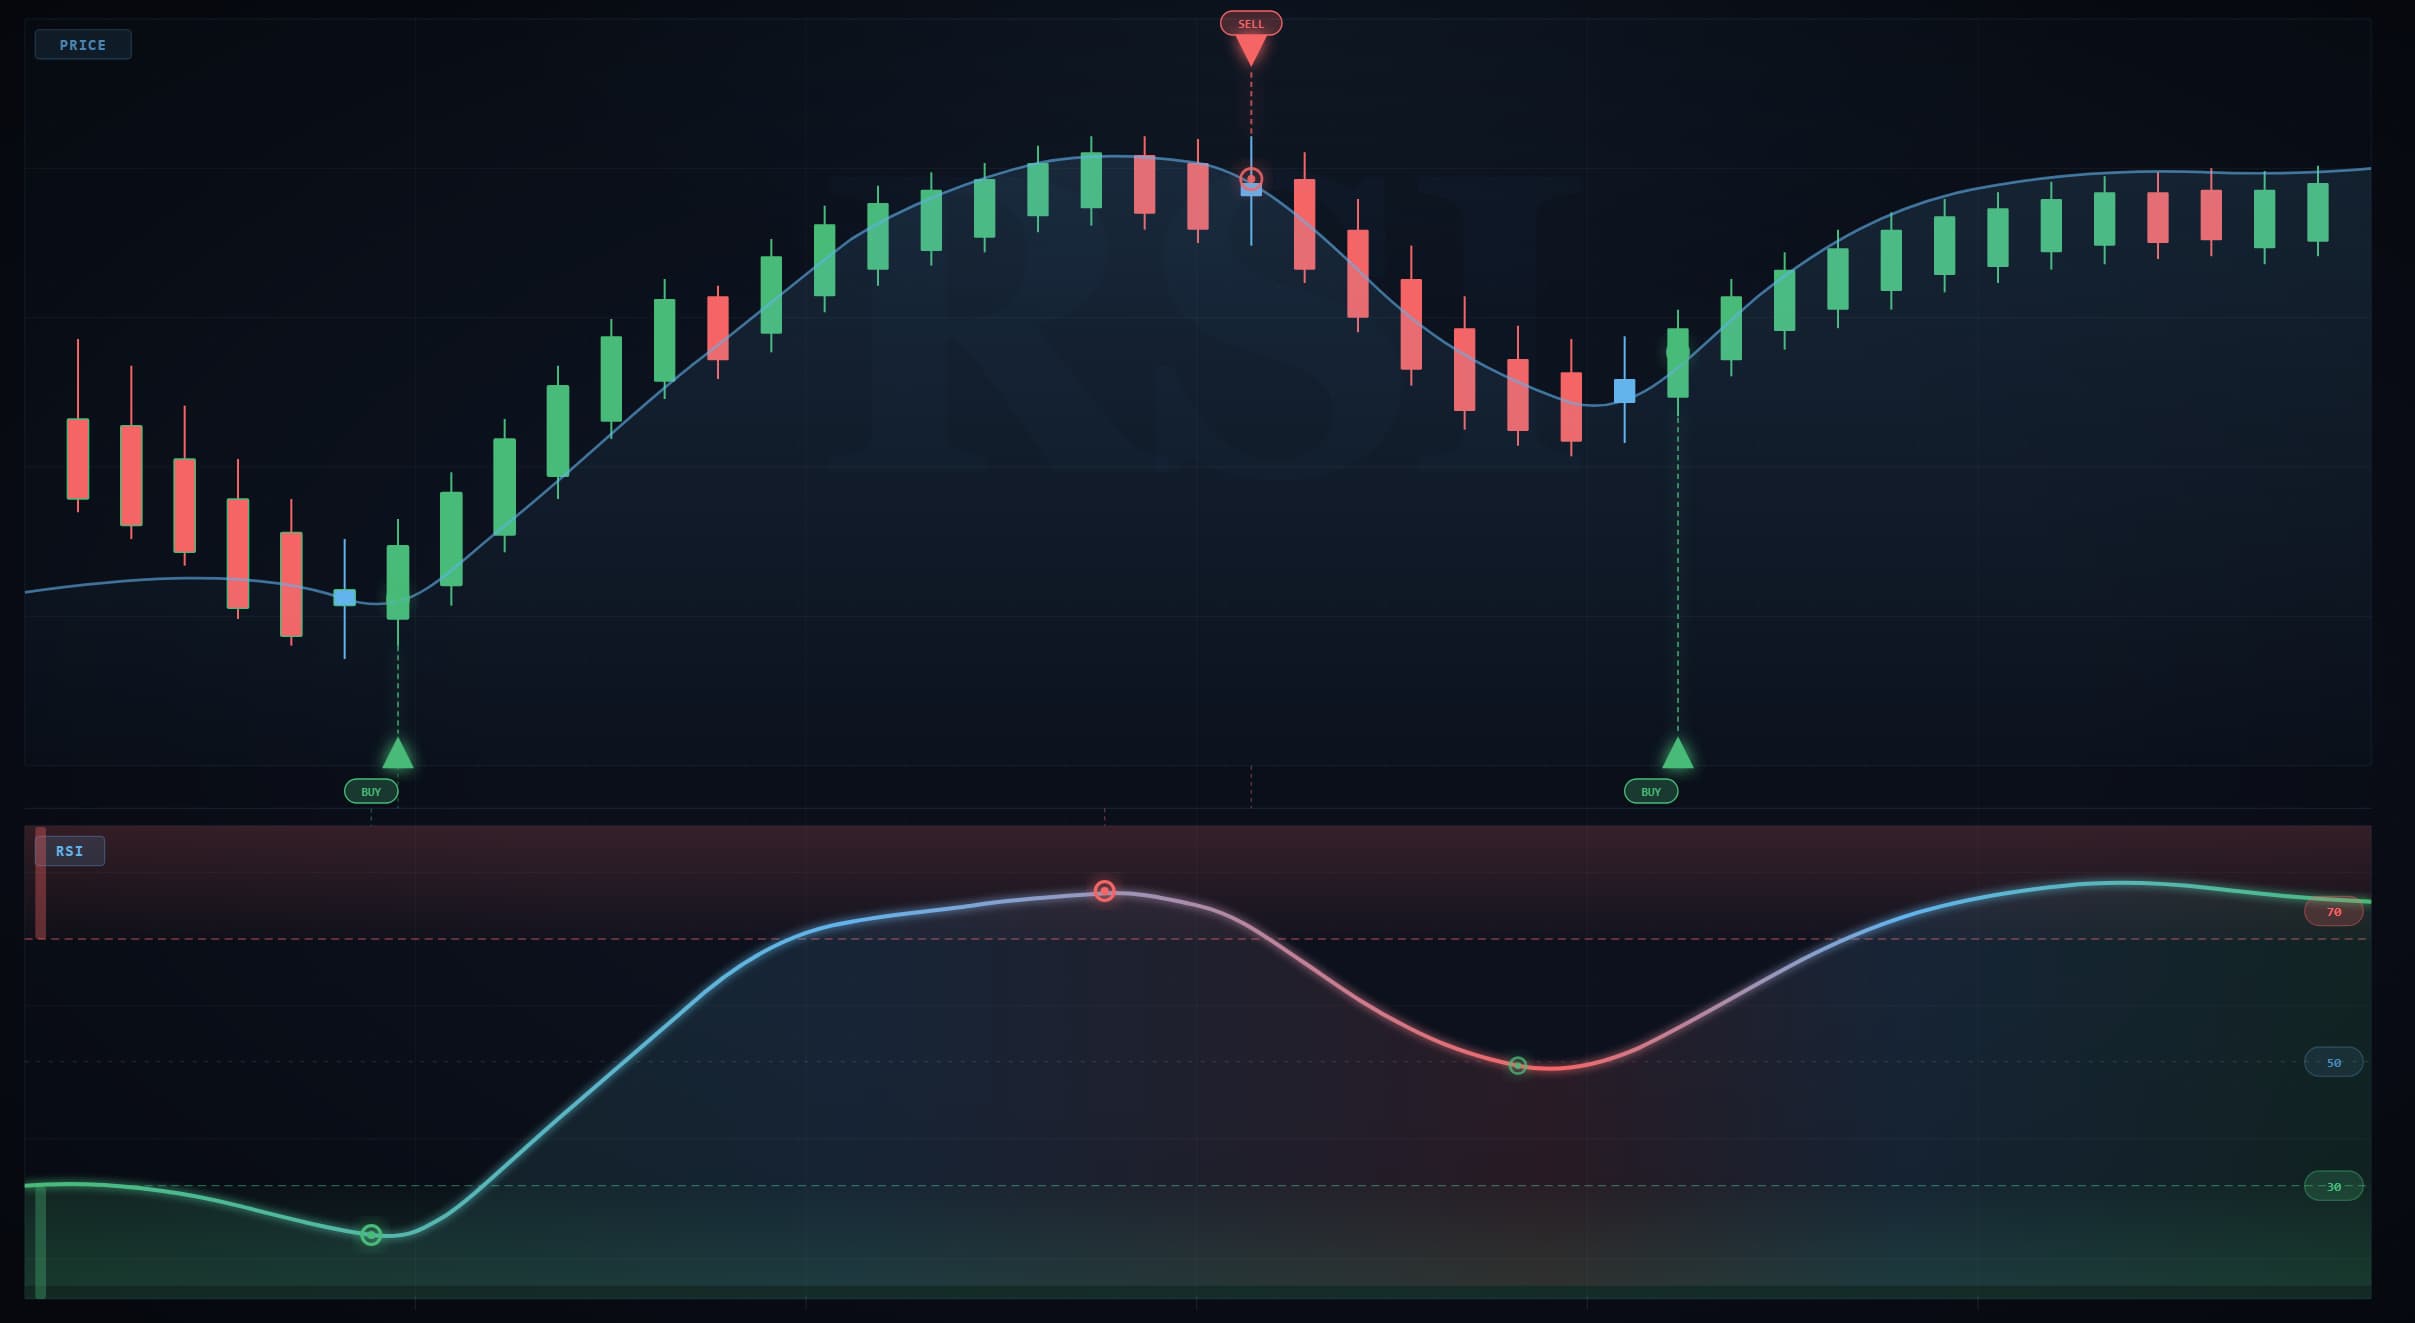
At ICunity, the Relative Strength Index (RSI) is one of the most popular indicators among beginner Forex traders. It is simple to use, easy to understand, and can help traders identify potential buying and selling opportunities.
Are you ready to transform your financial future?
Sign Up TodayNo credit card required • Free demo account • Instant activation
While RSI is not a magic tool, it can be a valuable part of a trading strategy when combined with proper risk management and market analysis.
What Is RSI?
RSI (Relative Strength Index) is a momentum indicator that measures the speed and strength of price movements.
The indicator moves between:
- 0 and 100
It helps traders determine whether a market may be:
- Overbought (price has risen too far too fast)
- Oversold (price has fallen too far too fast)
RSI was developed by J. Welles Wilder Jr. and remains one of the most widely used indicators in trading.
Understanding RSI Levels
Above 70 = Overbought
When RSI rises above 70:
- Buying momentum is strong
- The market may be due for a pullback
This does not automatically mean price will fall, but it signals caution.
Below 30 = Oversold
When RSI falls below 30:
- Selling pressure is strong
- The market may be due for a bounce
Again, this is not a guaranteed reversal signal.
How RSI Works
RSI compares recent gains to recent losses over a selected period.
The default setting is:
- 14 periods
This setting is commonly used across Forex, stocks, and other financial markets.
Platforms like TradingView and MetaTrader 5 include RSI as a built-in indicator.
Simple RSI Trading Strategy for Beginners
Step 1: Identify Market Direction
Before using RSI, determine the overall trend.
Uptrend:
Look mainly for buying opportunities.
Downtrend:
Look mainly for selling opportunities.
Trading with the trend generally provides higher-probability setups.
Step 2: Wait for RSI Signals
Buy Setup
Look for:
- Uptrend present
- RSI drops below 30
- RSI moves back above 30
This may indicate the pullback is ending.
Sell Setup
Look for:
- Downtrend present
- RSI rises above 70
- RSI moves back below 70
This may indicate the rally is weakening.
Step 3: Confirm with Price Action
RSI works best when combined with:
- Support and resistance
- Candlestick patterns
- Market structure
Example:
- RSI shows oversold
- Price reaches support
- Bullish engulfing candle appears
This provides stronger confirmation than RSI alone.
Example Trade
Imagine EUR/USD is in an uptrend.
What Happens:
- Price pulls back
- RSI falls below 30
- RSI moves back above 30
- Bullish candle forms near support
A trader may consider entering a buy trade with proper risk management.
RSI Divergence Strategy
One advanced RSI technique is divergence.
Bullish Divergence
- Price makes a lower low
- RSI makes a higher low
This may signal weakening selling pressure.
Bearish Divergence
- Price makes a higher high
- RSI makes a lower high
This may signal weakening buying momentum.
Many traders use divergence as an early warning of potential trend changes.
Best Timeframes for RSI Trading
Beginners often find RSI most effective on:
- 1-Hour (H1)
- 4-Hour (H4)
- Daily (D1)
Higher timeframes generally produce fewer false signals than very short-term charts.
Common RSI Mistakes
1. Buying Every Oversold Signal
An oversold market can remain oversold for a long time.
Always consider trend direction.
2. Selling Every Overbought Signal
Strong trends can stay overbought for extended periods.
Confirmation is important.
3. Ignoring Market Context
RSI should support your analysis, not replace it.
4. Using RSI Alone
The best results usually come from combining RSI with other trading tools.
The Role of News Events
Major economic announcements can cause sudden market movements regardless of RSI readings.
For example, decisions from the Federal Reserve can create sharp volatility in Forex pairs and temporarily invalidate technical signals.
This is why traders should always monitor important economic events.
Advantages of RSI
- Easy to understand
- Beginner-friendly
- Helps identify momentum
- Useful for spotting potential reversals
- Works across multiple markets
Limitations of RSI
- Can produce false signals
- Less effective in strong trends
- Not a standalone strategy
- Requires confirmation
No indicator can predict the market perfectly.
Final Thoughts
At ICunity, RSI is often recommended as one of the best indicators for beginner traders because it helps simplify market analysis and identify potential opportunities.
However, successful trading is not about finding the perfect indicator. It comes from combining tools like RSI with:
- Trend analysis
- Risk management
- Patience
- Discipline
Use RSI as part of a complete trading plan, and focus on consistency rather than trying to predict every market move.